Analyze the market, build and share trading strategies

TessTrade brings together traders and developers to turn scripts and ideas into collective market intelligence.

12x of R$ 97 or R$ 997 upfront · Instant access

Dev Python

Turn ideas into indicators Python

Organize hypotheses, define rules, and turn your trading reasoning into studies inside TessTrade.

Hypothesis

BTCMomentumVolumeTrendResistance
Active hypothesis

BTC loses strength above resistance as volume declines

Volatility compression before the breakout

Community

Publish insights and scripts

Show the community how you see the market.
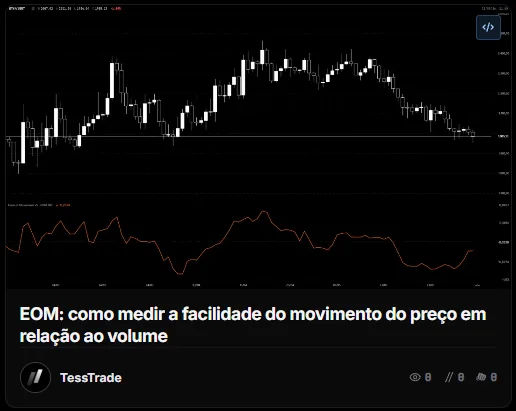
EOM: how to measure the ease of price movement relative to volume — TessTrade
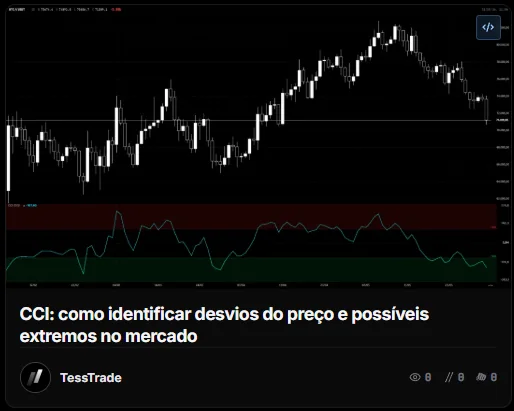
CCI: how to identify price deviations and possible market extremes — TessTrade
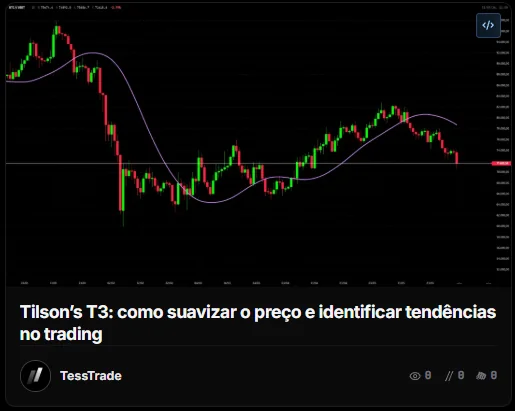
Tilson's T3: how to smooth price and identify trends in trading — TessTrade
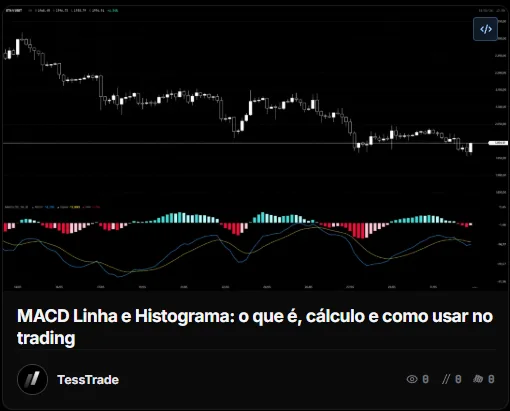
MACD Line and Histogram: what it is, how it's calculated, and how to use it in trading — TessTrade
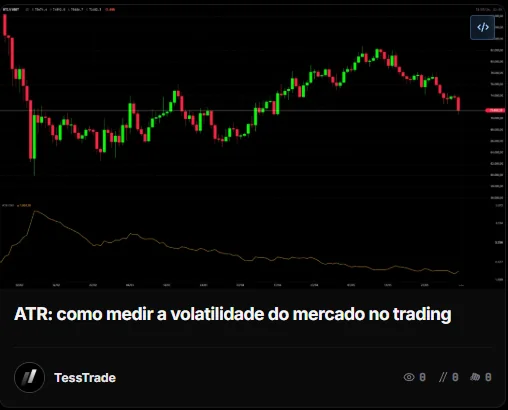
ATR: how to measure market volatility in trading — TessTrade
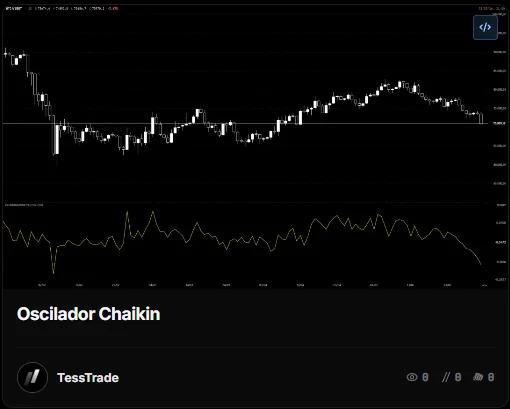
Chaikin Oscillator — TessTrade
EOM: how to measure the ease of price movement relative to volume — TessTrade
CCI: how to identify price deviations and possible market extremes — TessTrade
Tilson's T3: how to smooth price and identify trends in trading — TessTrade
MACD Line and Histogram: what it is, how it's calculated, and how to use it in trading — TessTrade
ATR: how to measure market volatility in trading — TessTrade
Chaikin Oscillator — TessTrade
Tilson's T3: how to smooth price and identify trends in trading — TessTrade
MACD Line and Histogram: what it is, how it's calculated, and how to use it in trading — TessTrade
ATR: how to measure market volatility in trading — TessTrade
Chaikin Oscillator — TessTrade
EOM: how to measure the ease of price movement relative to volume — TessTrade
CCI: how to identify price deviations and possible market extremes — TessTrade
Tilson's T3: how to smooth price and identify trends in trading — TessTrade
MACD Line and Histogram: what it is, how it's calculated, and how to use it in trading — TessTrade
ATR: how to measure market volatility in trading — TessTrade
Chaikin Oscillator — TessTrade
EOM: how to measure the ease of price movement relative to volume — TessTrade
CCI: how to identify price deviations and possible market extremes — TessTrade
Macro Lens

The macro read before the technical read

See how the major indices, currencies, commodities, and crypto assets are behaving before making any trading decision.

Nexus

From insight to connected knowledge

Memory isn't a dead archive. Before any decision there's research, hypothesis and context. TessTrade organizes that process in a single environment.

Intelligence

Simon: the intelligence layer
inside TessTrade

Analyze context, organize hypotheses, and move faster when building indicators.

Helps structure hypotheses
Connects ideas, code, and analysis
Plan

Access TessTrade Pro

TessTrade Pro brings the platform's features together in a single annual subscription for traders who want to analyze, build, and grow with more depth.

Annual Subscription

TessTrade Pro

The complete TessTrade structure to analyze the market, build strategies, and organize your operation in a single environment.

Full access12 months of Pro

Annual plan in up to 12x

12x ofR$97

or R$ 997 upfront

Access to TessTrade Pro for 12 months

Secure payment · Card installments

Everything included in Pro

  • Full access to TessTrade
  • Macro Lens for market overview
  • Integrated community
  • Advanced charts and workspaces
  • Priority on new features
  • Dev Python for building indicators and scripts
  • Nexus for organizing studies
  • Simon for analysis support
  • Inkspace for visual maps and flows

Full platform access. One plan, no complications.

TessTrade Pro

Everything included
in TessTrade Pro

A complete structure to analyze the market, develop your ideas, and organize your operational routine in a single environment.

Macro Lens
Overview
Complete + modular
Market Map
Economic calendar
Charts & Workspaces
Charts per tab
4
Indicators per chart
10
Saved workspaces
10
Custom timeframes
Renko chart
Watchlists
Unlimited
Assets per watchlist
500
Color-tagged symbols
7
Simultaneous connections
10
Nexus — Notes
Number of notes
500
Public sharing
Private sharing
100/mo
Note folders and collections
20
Version history
30 days
Note attachments
50 MB
Nexus storage
10 GB
Note search
Advanced

Access to all TessTrade features in a single annual subscription.

FAQ

Frequently asked questions
about TessTrade

Understand how the platform works, what's available now, and how it evolves over time.

What is TessTrade?
Does TessTrade have real-time data?
What can I do on TessTrade today?
Do I need to know how to code to use it?
Can I place trades directly through TessTrade?
What is Macro Lens?
What is Nexus?
What is Simon?
Can I share my ideas with other traders?
Does TessTrade promise financial results?
Who is TessTrade for?
Does the TessTrade subscription renew automatically?
Does TessTrade offer refunds?

Ready to access TessTrade Pro?

Get access to the complete platform to analyze the market, build with Python, organize your studies, and grow your operation with more depth.

12x of R$ 97orR$ 997 upfront
Annual platform access
Instant access
Active community
tess.app
Macro Lens
Charts
Python
Indicators
Nexus
Inkspace
Community
Simon
Synced
Connected